USA Crime Stats
Murder arrests by race.
Which race gets arrested for murder the most, in the U.S.? Unfortunately, the statistics for Whites and Blacks are included with White Hispanics and Black Hispanics. And then it depends on year. For 2009, Whites had 4,741, while Blacks had 4,801. For 2010, Whites had 4,261 murder arrests while Blacks 4,209. Blacks led in 2011 with 4,149 and Whites 4,000. The gap had widened more in 2013 with Blacks at 4,379 and Whites at 3,799.
Starting in 2013, for the 1st time the FBI had separated White Hispanics and Black Hispanics from Whites and Blacks, into a new data collection system, called the National Incident-Based Reporting System (NIBRS), but not all statistics have transferred over.
Imprisoned people by race.
As of mid-2004, the % of people that are in prison or jail, by race, for the ages 25-29 group, are about 12.6% for Black males, 3.6% Hispanic males, and 1.7% White males. For all ages, is 4.9% Blacks, 1.7% Hispanics, and .7% Whites.
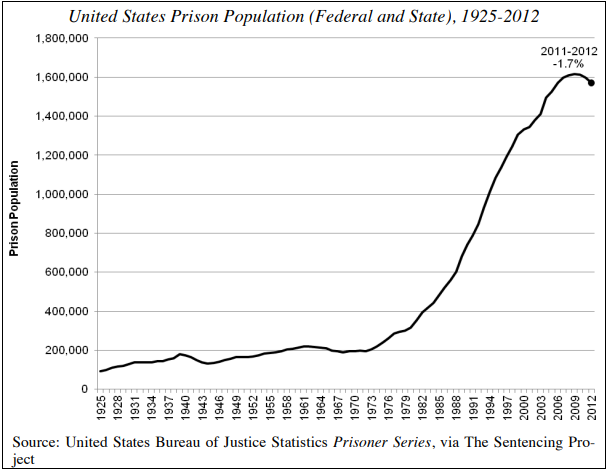
Prison populations.
As of Dec. 31, 2018, 87.1% of prisoners are in a state prison jurisdiction, 12.9% federal.
In 1970, the U.S. prison population (state and federal) was under 200,000 (196,429). It hit a record 1.6 million in 2009. Then on May 23, 2011, the U.S. Supreme Court ordered California to reduce to 137.5% of their capacity, so California released a little 15,493 inmates, or 18% from 2010 to 2012 while its jail population increased 12%. New Jersey and Connecticut also dropped their prison population by more than 4.5%, but no other state released more than 1,500, and the federal prison population grew from 2010 to 2011 by over 6,000 people. The USA prison population declined in 2010 for the 1st time since 1972.
The U.S. Supreme Court decision was a 5-4 vote, with 1 of the justices from California voting in favor for California's release, of 46,000 criminals. California's legislation restructured their penal system mostly by shifting prison inmates, which are subject to the court order and an expense to the state, to county jails, which are not subject to the court order and are an expense of the counties. Almost 500 felonies were redefined by the legislature so that they could only be served in county jail and the state provided the 3 "non-non-nons," that is non-serious, non-violent, and non-sexual offenders, will always serve their time in county jail.
According to a Dec. 2017 report for California, as much as 4,315 inmates were in a out-of-state prison.
By the end of 2012, the U.S. prison population stood at 1.57 million people, constituting a 1.7% reduction from the previous year. In 2012, while 28 states reduced their prison population that year, contributing to a national reduction of 29,000 inmates, 51% (or 15,035) of that reduction was due solely to California.
California’s jail inmate population had fallen to its lowest level in decades (69,404) in June 2011, but then its populations began to increase due to realignment and by year-end 2012, California jails held 78,878 people (7.4% increase). California’s jail population continues to increase: as of Jan. 2014, the average daily population equaled 81,914 (a 1-year increase of 2.5%).
In 2012, Goldman Sachs announced that it would invest $10 million in a new jail program using social impact bonds. In January 2014, Bank of America Merrill Lynch announced it had raised $13.5 million from over 40 private and institutional clients, financing a reform initiative for previously incarcerated New York state offenders.
Case study on June 30, 1994:
-There are 919,143 adult prisoners in 1291 state prisons.
-There are 93,708 adult prisoners in 70 federal prisons.
-Altogether are 93.9% male and 6.1% female.
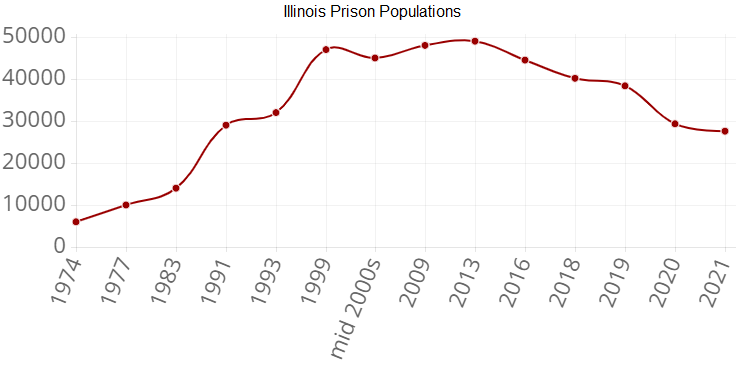
According to the Illinois Department of Corrections, Illinois spends about $45,828 a year per incarcerated person. In a 2023 study by the Prison Policy Initiative, the state's incarceration rate was at 433 per 100,000, higher than every industrialized country, except the United States. When compared with its surrounding states, Illinois was the lowest. Kentucky and Missouri have rates over 700 per 100,000.
Case study: killings by the Chicago police since 1970.
Of over 800 documented cases, the following came to Chicago from another state, to get killed by the Chicago police:
2010s: Indiana (2)
2000s: 0.
1990s: Oklahoma (1)
1980s: Tennessee (1), New Jersey (1), Virginia (1), Indiana (1), Texas (1)
1970s: Missouri (2), Arkansas (1), Michigan (1), Indiana (1), Wisconsin (1), West Virginia (1), Louisiana (1)
It is believed that the Chicago police has killed people that were born in other countries, such as Poland, Honduras, and Cuba.
Where they accidentally killed themselves running from Chicago police.
2010s: New Jersey (1)
1970s: Indiana (1)
Where they suicided when CPD came.
2010s: Indiana (1), Wisconsin (1)
2000s: Colorado (1)
For people born in other countries that suicided, include Iran.
Case study: where an off-duty officer killed someone farther outside their jurisdiction (where 1 of the jurisdictions is a large city).
California:
-In 2008, an off-duty LAPD officer got into a vehicle collision with someone on a highway, in Corona, CA, but the victim kept driving away, and the officer pursued a high-speed chase, eventually got into an argument and killed him in Lake Elsinore. [59 miles]
-In 2019, an off-duty LAPD officer was shopping at a Costco store in Corona, while holding his child, when he was assaulted by a mentally ill patient, and killed him. [40 miles]
Florida:
-In 2008, an off-duty Daytona Beach officer killed someone in Orlando, FL. The victim and the officer shot each other, where only the victim died, and the officer also shot a 2nd person who survived. [51 miles]
-In 2009, an off-duty Palm Beach County Sheriff killed someone in Miami Beach, FL (2 counties away) after the victim pulled a knife on the sheriff and demanded money. The victim was from Massachusetts, and the officer was formerly a cop with Lake Worth, which merged into Palm Beach County in Oct. 2008. [57 miles]
Texas:
-In 2010, an off-duty Houston officer, visiting family in a suburb of Dallas (Arlington, TX), witnessed a fight between gang members and killed a member of the CSB gang. [230 miles]
-In 2012, an off-duty Houston officer, visiting his beach house in Galveston, TX, saw it was ransacked, and found someone in his home. The victim asked the officer what he was doing and said this was his house, but the officer said this is my house and I'm a cop. [47 miles]
The distance are provided as air distance.
PRWORA Act, signed by President Bill Clinton on Aug. 23, 1996.
This was to ban people with drug convictions from receiving SNAP or TANF, under Section 115, however, it allowed states the choice to not enforce this ban. Most states complied with it (32) but made their own modifications.
The 18 states that never enforced this as of 2001, are Illinois, New York, Michigan, Ohio, New Jersey, Washington, Oregon, Oklahoma, Louisiana, Minnesota, Wisconsin, Colorado, Iowa, Utah, Hawaii, Nevada, New Hampshire, and Vermont.
Florida and North Carolina made their version where SNAP or TANF ineligibility only applied to convicted drug traffickers. Texas followed the ban, but loosened it in 2015 to people with 2 or more drug convictions, but people with 1 drug conviction had to comply with the terms of their parole or probation, such as drug treatment programs.
Since 8/22/1996, 11 million Americans have received felony drug convictions in U.S., by 2024.
Nearly 1 in 8 individuals in the U.S. received food stamps in 2021 (Hall & Nchako, 2022). In 2022 by state, that's 1 in 6 in Illinois, 1 in 7 in Michigan and New York, 1 in 8 in California and Florida, and 1 in 9 in Texas.
Serving pork in prisons.
Cutter v. Wilkinson (2005) upheld the Religious Land Use and Institutionalized Persons Act (RLUIPA), requiring prisons to reasonably accommodate inmates’ religious practices (including diets). Under RLUIPA and the First Amendment, prisons can’t force Muslim or Jewish inmates to eat pork. They must provide alternatives.
In Oct. 2015, the Federal Bureau of Prisons (BOP) announced it would stop serving pork to inmates, citing lack of popularity and cost concerns, though some advocacy groups noted it also avoided religious accommodation conflicts.
In March 2025, Illinois passed a law called the Faith by Plate Act requiring public institutions, such as public schools and including correctional facilities, to make halal and kosher meal options available.