
Mathematical Concepts
Suppose you have a fraction that looks like this, with 4 variables.
If A get bigger, then C gets bigger, but only if provided B and D remain constant.
If A and B both get bigger, while D remains constant, then you are unable to predict the behavior of C, as A getting bigger would tend to make C get bigger while B getting bigger would tend to make C shrink, and you don't know which effect would dominate. But if you were told that A was getting bigger while B was geting smaller, and D remains constant, then you could predict that C will grow.
Also, to make things more complicated, if A gets bigger, B and D remain constant, but are of opposite signs, then C must get smaller.
Another way to look at this, is to bring 1 by itself, so A = CB/D, and you can reread the above.
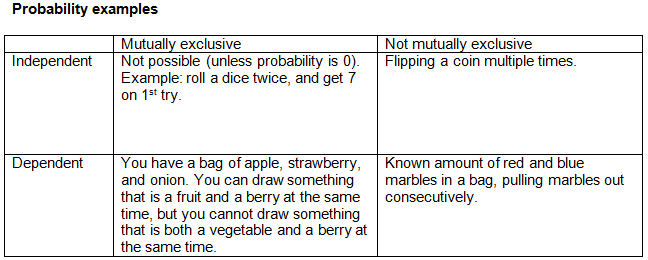
Probability Theory
If you flip a coin, it is always probable to flip it to land either heads only, or tails only. There is no guaranteed number where you will end up with the opposite side. So, it is possible to flip a coin a million times, and get heads only, or tails only, and then the 1-million-and-1th try, get the opposite coin.
So for a question like, how many students in a school does it take before every birthday is filled up? The answer is never. But you can with hitting a percentage say, 99% and 99.9%.
There's about 365 days in a year. Double that is 730. So a school that has 730 students, is enough to equally fill every day as 2 peoples birthday. But in reality, a school with 730 students, will not equally fill every day as someones birthday. The simple reason being is whenever 3 students can have the same birthday, then that guarantees someone birth date will be unfilled. Or even if 4 students have the same birthday.
So we use this formula, r > -n log((1 - p) / n). Here, n = 365. So for 100% probability, p = 1, then you have log(0) which is undefinable.
If p = .9, r > 2994.
If p = .95, r > 3247.
If p = .99, r > 3835.
If p = .999, r > 4675.
So a school has to have 3835 students in there for there to be a 99% chance that every birthday is filled.
But that there being a 1% chance that there is not a birthday filled, is it 1 days, or 2 days? That number includes 1 up to 364 days, that are nobodys birthday. That includes if all 3835 students all had a birthday of April 1. The probability of that happening is about 4 * 10-9827.
This above table, is useful for knowing answers to questions like, has my municipal police, killed someone on my birth day before? If the particular police department have killed at least 3835 people, (going back however long), then there is a 99% chance that the police killed someone on your birthday.
What is the probability of not finding a birthday of Dec. 31 if you get the birthdays of 730 people? That's (364/365)730, = about 13%. For 3835 people, that's about 2.69%.
Probability.
Not mutually-exclusive and independent circles:
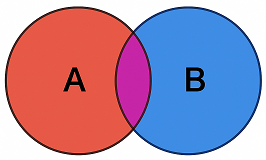
If the red and blue circle do not overlap, then they are dependent, and mutually exclusive.
In this image, the A and B are also known as P(A) and P(B), where p stands for probability of. The shaded purple (actually magenta) is where A and B overlap, and that is called P(A ∩ B), where ∩ = intersection of. If you want to substract the magenta area, then that is P(A) + P(B) - P(A ∩ B). Disjoint is another word for mutually exclusive. P(A ∩ B) is also the same as P(B ∩ A).
The sum of the 2 circles is always P(A) + P(B) - P(A ∩ B) otherwise you're adding the overlap twice. Therefore, in indepedent events, and mutually exclusive events, you don't need to substract anything because the overlap is 0, so there is no overlapped circle, so P(A ∩ B) = 0.
When you do multiply the circles? When they are independent, but there can still be an overlap. An example of this is flipping a coin multiple times in a roll, or flipping a coin and rolling a dice at the same time. So the probability if you drinking coffee, and the probability of a rainy day, are 2 such numbers. The probability that you will drink coffee on a rainy day, you multiple those 2 numbers.
In independent and not mutually exclusive, the overlap equals P(A)P(B). However, in dependent and not mutually exclusive, even though there is an overlap between the circles, the overlap cannot be P(A)P(B), meaning the overlap is either larger or smaller than expected. The 1st is we can assume that the overlap P(A ∩ B) is P(A)P(B), the 2nd is we cannot assume that.
So for independent and mutually exclusive, the diagram would in actuality be 1 circle. In theory, it would be 2 circles with no overlap, but the 2nd circle would have an area of 0, making it effectively only 1 circle.
Statistics.
Regression is a technique where we use certain variables (explanatory, independent) to explain (or sometimes predict) a variable (dependent) precisely.
A linear regression is one where the dependent variable is assumed to have a linear dependence on the explanatory variables.
Y = ß0 + ß1*X + e
• Where Y is the dependent variable, and X is the independent variable.
• where ß0 is the intercept, ß1 is the slope, and e is the error term or random noise (the difference between observed and predicted values).
Linear regression is used to explain a variable Y in terms of a few variables of X.
The equation of the graph is y = ß0 + ß1*x, where ß0 is intercept and ß1 is slope.
The 1st equation is the full statistical model, while the 2nd formula is the deterministic fitted line.
R and r.
What is R˛? Called coefficient of determination. R˛ tells you how much of the variation in the dependent variable (Y) can be explained by the independent variable(s) (X). A 0 means no relationship and a 1 means perfect relationship (all points fall on the regression line).
So R˛ answers “How much of Y is explained by X?”
Adjusted R˛ is a corrected version of R˛ that tells you how well your regression model fits the data, but penalizes you for adding useless extra variables. R˛ always increases (or at least never decreases) when you add more independent variables to a regression model.
Correlation heatmaps maps r data, not R˛. In correlation heatmaps, r is the correlation coefficient, and measures the strength and direction of a linear relationship between 2 numerical variables. This ranges from -1 to 1, in which 0 is no linear correlation, but -1 is negative linear correlation. These are usually the Pearson correlation coefficient. R = |r|.
The difference is, the 2 variables for r can be independent, dependent, or a mix. For R, 1 variable must be independent and the other dependent. And if you swap the order, the model changes, as the roles are not symmetrical. The independent variable X goes to the x-axis, while the dependent variable Y, goes to the y-axis.